County
Riverside County
California
2,478,600 population$93,074 median income1,881,231 voting age0 active campaigns
Loading map...
Officials Representing Riverside County


US House


State Legislature

Corey Jackson
Democratic
State House · District 60

Greg Wallis
Republican
State House · District 47
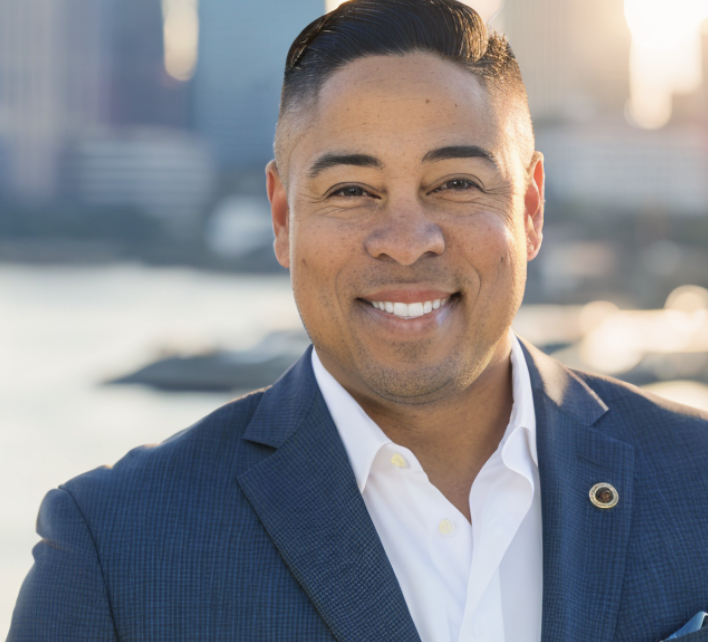
Jeff Gonzalez
Republican
State House · District 36

Kate Sanchez
Republican
State House · District 71
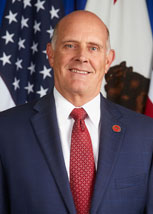
Kelly Seyarto
Republican
State Senate · District 32
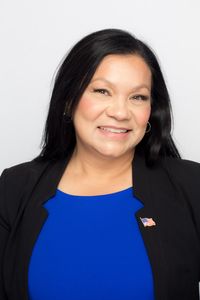
Leticia Castillo
Republican
State House · District 58
Natasha Johnson
Republican
State House · District 63
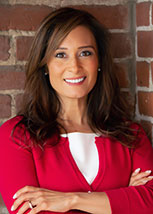
Rosilicie Ochoa Bogh
Republican
State Senate · District 19

Sabrina Cervantes
Democratic
State Senate · District 31
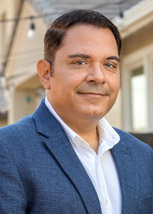
Steve Padilla
Democratic
State Senate · District 18
Congressional District Coverage
Riverside County is 72% in CA Congressional District 25, 18% in CA Congressional District 41, 5% in CA Congressional District 48, and 4% across 3 other districts.
Area-weighted; population-weighted shares may differ in counties with large urban/rural density splits.
Median Income
$93,074
↓ 6%vs $99,122
Bachelor's+
25.6%
↓ 31%vs 37.1%
Under 18
24.1%
↑ 10%vs 22.0%
Owner-Occupied
69.1%
↑ 24%vs 55.9%
White (non-Hispanic)
37.6%
↔ 5%vs 39.7%
Demographics
American Community Survey 2024 5-year estimates
Race & Ethnicity
White37.6%
Hispanic/Latino51.3%
Black6.4%
Asian7.1%
Two or More22.1%
Other26.9%
Income & Economy
Median Household Income$93,074
Per Capita Income$38,317
Poverty Rate10.6%
Unemployment6.5%
Education
High School+83.5%
Bachelor's+25.6%
Housing
Median Home Value$557,300
Median Rent$1,901
Owner-Occupied69.1%
Health Insurance
Uninsured7.7%
Age Distribution
Under 1824.1%
65 and Over15.4%
Median Age37.0