County
San Bernardino County
California
2,197,104 population$85,478 median income1,636,726 voting age0 active campaigns
Loading map...
Officials Representing San Bernardino County


US House


State Legislature

Eloise Reyes
Democratic
State Senate · District 29

Greg Wallis
Republican
State House · District 47
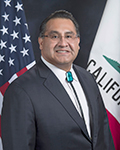
James Ramos
Democratic
State House · District 45
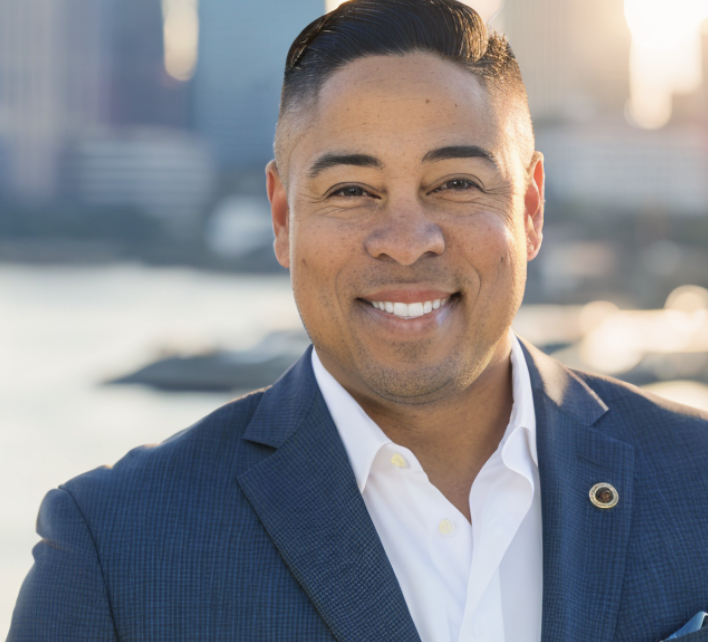
Jeff Gonzalez
Republican
State House · District 36

John Harabedian
Democratic
State House · District 41

Juan Carrillo
Democratic
State House · District 39
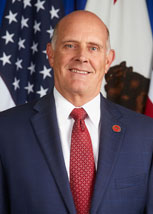
Kelly Seyarto
Republican
State Senate · District 32
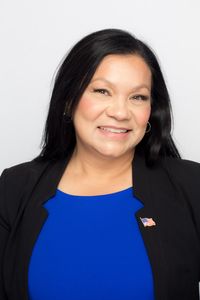
Leticia Castillo
Republican
State House · District 58
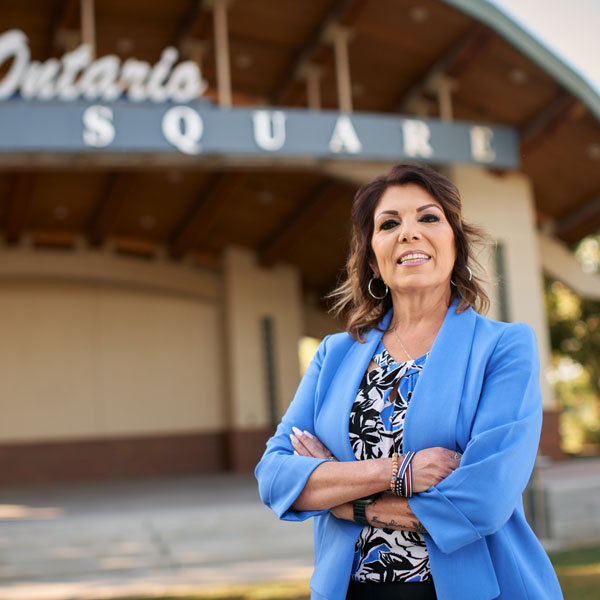
Michelle Rodriguez
Democratic
State House · District 53

Phillip Chen
Republican
State House · District 59
Congressional District Coverage
San Bernardino County is 84% in CA Congressional District 23, 13% in CA Congressional District 25, and 3% across 4 other districts.
Area-weighted; population-weighted shares may differ in counties with large urban/rural density splits.
Median Income
$85,478
↓ 14%vs $99,122
Bachelor's+
23.3%
↓ 37%vs 37.1%
Under 18
25.5%
↑ 16%vs 22.0%
Owner-Occupied
62.1%
↑ 11%vs 55.9%
White (non-Hispanic)
32.9%
↔ 17%vs 39.7%
Demographics
American Community Survey 2024 5-year estimates
Race & Ethnicity
White32.9%
Hispanic/Latino55.2%
Black7.8%
Asian8.4%
Two or More22.0%
Other28.8%
Income & Economy
Median Household Income$85,478
Per Capita Income$34,343
Poverty Rate13.3%
Unemployment7.1%
Education
High School+82.5%
Bachelor's+23.3%
Housing
Median Home Value$505,000
Median Rent$1,801
Owner-Occupied62.1%
Health Insurance
Uninsured8.0%
Age Distribution
Under 1825.5%
65 and Over12.6%
Median Age34.7